")
Let me be upfront: most SEO reports don’t do much.
Not because the data is wrong. But because the client receives them, flicks through them, and has no idea what to do next. They don’t know if things are going well or badly. They don’t know what to decide. And when they pay the next invoice, they do it with a nagging feeling that they have no clue what they’re paying for.
That’s your problem, not theirs.
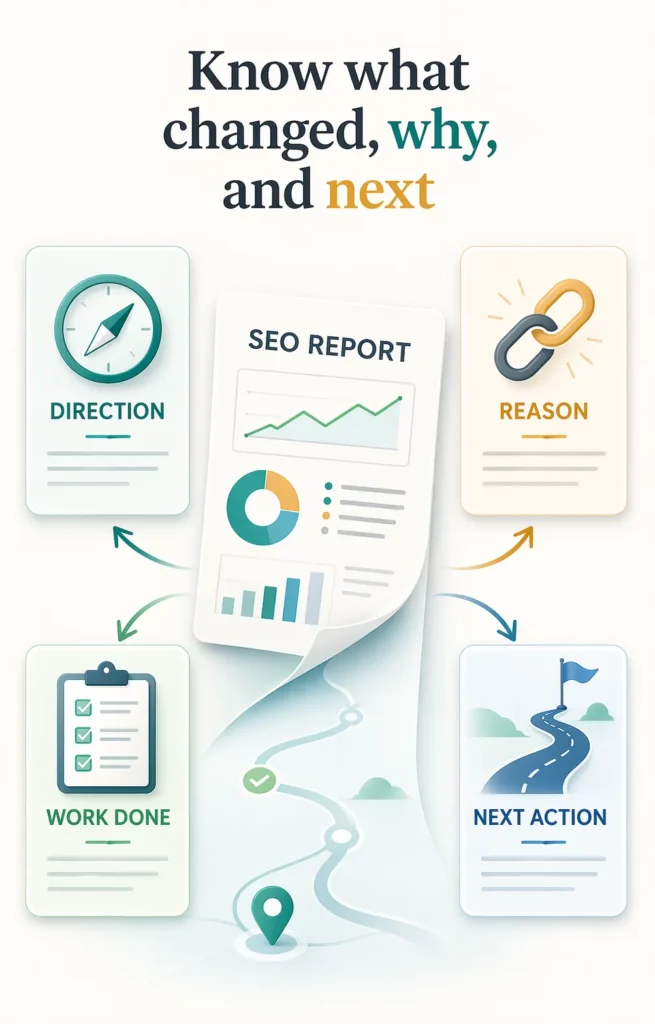
A good SEO report answers three basic questions: are we making progress, why, and what do we do now? If the report you send every month doesn’t answer those three questions clearly, the number of charts it contains is irrelevant.
In this article I’ll cover what to include, in what order, which metrics earn their place and which just fill space, and how to adapt the report depending on the type of project you’re working on.
First, the context that changes everything in 2026
Before getting into structure, there’s something you need to know about how the data has shifted.
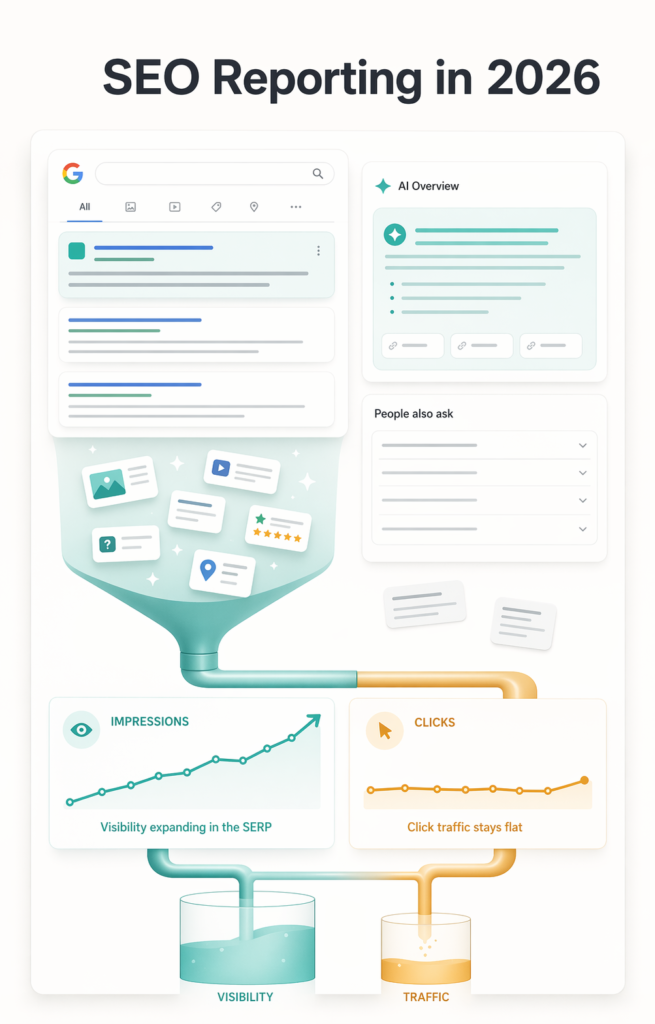
Around 60% of Google searches now end without a click, because AI Overviews answer the question directly in the SERP. According to SparkToro, 61.5% of desktop Google searches and 34.4% of mobile searches result in no click at all.
What does this mean for your report? That organic traffic no longer tells the full story.
A site can be gaining real visibility, appearing more in the SERP, being cited in AI answers, and still show flat or declining traffic. If you only report clicks, it looks like failure. If you also report impressions, average position and AI visibility, the picture changes completely.
Reporting organic traffic without impressions in 2026 is like reporting revenue without pipeline. The number you’re showing doesn’t explain what’s actually happening.
With that said, let’s get into the structure.
Who is the report for
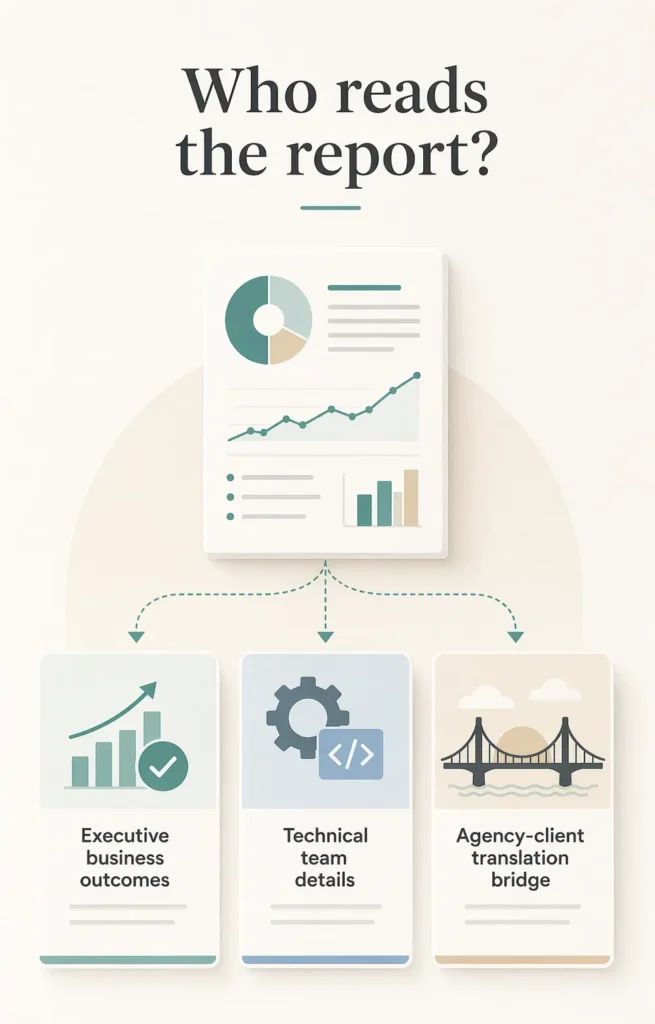
Before deciding what goes in, decide who reads it. It’s not the same report for everyone.
For executives or non-technical clients, what matters is whether the investment is working and whether there’s anything they need to act on. They don’t care about the crawl error count. They want to see business outcomes: organic traffic, leads, conversions, trends. Technical data only appears when it directly explains a change in those business metrics.
For an internal technical team, you can go much deeper. Which redirect chains got resolved, which pages still have coverage problems, which keyword clusters moved. The executive summary still matters, but the body of the report can get into the weeds without losing anyone.
For agency clients, the challenge is translation. The agency knows the technical work. The client knows their business goals. That gap is where reports either build trust or erode it. A good agency report converts technical work into business language without hiding the technical reality: what was done, what it produced, what comes next.
The structure that works
The order matters as much as the content. Business outcomes first, then the activity that generated them, then what happens next.
Executive summary
One page maximum. Answers three questions:
- What’s the headline number for this period?
- What drove it?
- What’s the next priority?
No jargon. No hedging. If organic traffic is down, say it’s down and explain why. If the technical fixes from last month improved crawl coverage, say so with specific numbers. The executive summary is for the person who won’t read the rest of the report but still needs to know what’s happening.
Organic traffic
It’s the first section almost everyone looks for, so put it first.
The key number is organic sessions or users for the period compared to the same period the previous year, not month over month. Monthly comparisons are noisy because of normal weekly variation. Year-over-year comparisons show the actual trend.
Always pair the traffic number with ranking history. The rank tracker gives you that correlation automatically: if traffic drops without ranking changes, the problem is CTR or an AI Overview taking up space. If rankings and traffic both drop, it’s a content or authority problem. Without that context, the client just sees a number going up or down and has no idea why.
A useful data point for framing ranking movements: the top three organic results capture 68.7% of all clicks, and only 0.78% of users ever visit page two. When you explain to a client what moving from position 8 to position 3 means, that number makes it concrete immediately.
AI visibility
This section didn’t exist in reports two years ago. It should be in all of them now.
AI visibility measures how often a brand is mentioned, cited, and recommended across AI surfaces like Google’s AI Overviews, AI Mode, and ChatGPT. As more searches get answered without anyone clicking through, showing up in those answers becomes as strategically important as organic ranking position.
What’s worth tracking:
- How often your pages appear as cited sources in Google AI Overviews for your target queries
- Whether the brand gets mentioned in AI-generated answers even without an explicit link
- Whether the citation trend is growing or falling over the reporting period
The research on what drives AI citations is increasingly specific. According to Surfer SEO, the typical AI Overview-cited article covers 62% more facts than the typical non-cited one. Content that includes between 5 and 7 statistics has a 20% higher likelihood of being cited. These aren’t abstract signals. They’re direct inputs for next month’s content decisions.
The AI optimization tool tracks citation frequency and surfaces which pages are being picked up by AI systems and which aren’t, giving the report a concrete baseline to work from.
Keyword rankings
The most common mistake here is including too much. You don’t need to show every keyword the site ranks for. Show the ones that matter: the core commercial terms the business cares about, the ones specifically worked on during the period, and any significant movers in either direction.
The most useful way to segment ranking data:
- Positions 1 to 3: Already driving traffic. The work here is defense, not growth.
- Positions 4 to 10: The highest-leverage group. Small improvements here produce real traffic gains. The first featured snippet gets a 42.9% CTR; without a featured snippet, the first organic result takes 39.8% of all clicks.
- Positions 11 to 30: The most realistic growth opportunity. These pages already have enough relevance to rank, they just need targeted improvements to break into the top 10.
Also report which keywords entered and exited the top 10 during the period. It’s more actionable than the total number of ranked keywords, which can look stable while the important terms quietly slip.
One thing most reports skip: impressions from Google Search Console. A page can hold its position while impressions fall, which signals that search volume is declining or that AI Overviews have pushed it below the fold. Impressions catch this weeks before traffic does.
Technical health
This section belongs in every report, but its weight should reflect how significant technical issues are for the site right now. A site with no critical crawl errors doesn’t need four pages of technical SEO. One that just went through a migration or has indexing problems needs this section near the top.
The data points always worth including:
- Index coverage: Pages indexed versus pages submitted. A growing gap needs an explanation.
- Crawl errors: Specifically the 4xx and 5xx errors on pages that matter, not the total error count, which includes irrelevant URLs.
- Core Web Vitals: Pass or fail on mobile and desktop for the highest-traffic pages. Not every page, not the site-wide aggregate. Web Almanac 2025 data shows HTTPS adoption above 91%, title tag adoption near 99%, and canonical adoption at 67%. These are the current baseline standards. If the site falls below them, the report needs to say so.
- Redirect health: Whether the redirect chains identified in previous audits have been resolved.
The SEO audit generates all of this in a structured format. The rule for what goes in the report versus what goes in the technical working document is simple: critical issues go in the report, full technical detail goes to the team that needs to fix it.
Backlink profile
Backlinks are a lagging indicator. A link acquired this month rarely moves rankings this month. That doesn’t mean they shouldn’t be in the report, it means the framing needs to be honest about timelines.
Nearly 80% of SEO professionals say link building is a central part of their strategy, and 78% report satisfying ROI from their campaigns. The focus has shifted from volume to quality: a handful of links from relevant, trusted sites consistently outperforms dozens of generic directory links. The report should reflect that distinction rather than celebrating raw acquisition numbers.
What to include:
- New referring domains acquired in the period, with their domain rating
- Lost referring domains, particularly high-authority ones worth recovering
- The total referring domain count trend over time, not the total backlink count, which fluctuates for irrelevant reasons
One data point that carries increasing weight in reports: according to SE Ranking research, sites with over 32,000 referring domains are 3.5 times more likely to be cited by ChatGPT than those with up to 200. The link between backlink profile strength and AI citation frequency is now a concrete business argument for link building, not just a classic SEO metric.
The backlink explorer tracks new and lost links over time, which is what actually belongs in a monthly report versus a one-time audit.
Content performance
The section most reports skip, and the one that contains the most actionable information.
Which pages drove the most organic traffic this period? Which are declining? Is the new content published during the period indexing and gaining traction?
The content analyzer tool identifies which pages are underperforming relative to their potential, which is a more useful signal than raw traffic numbers. A page getting 200 visits per month for a keyword with 10,000 monthly searches tells a completely different story from a page getting 200 visits for a keyword with 300 monthly searches.
Work completed and next steps
This is where the report closes the loop between activity and results.
Work completed is not a task list. It’s not “we published 12 pieces of content” without saying whether any of them are ranking. It looks more like: “we updated the five pages identified in last month’s content decay audit; two have already recovered their previous positions, three are indexed but haven’t moved yet.”
Next steps need to be specific enough that the client can hold the team accountable. “We’ll continue improving content quality” is not a next step. “We’ll update the three product category pages identified in the audit and apply the fix to the canonical tag issue affecting 42 product variants” is.
Which metrics earn their place (and which don’t)
Metrics worth including
- Organic sessions / users year over year: The primary traffic health signal
- Impressions from Search Console: Catches SERP changes before traffic data does
- AI visibility and citation frequency: The most important forward-looking signal in 2026
- Organic conversions and conversion rate: Connects SEO to real business outcomes
- CTR for target keywords: A CTR drop without a ranking drop points to a SERP feature or title tag problem. Pages with a keyword in their URL have a 45% higher CTR, and Google is 57% more likely to rewrite titles it considers too long.
- Referring domain count over time: The real backlink health signal
- Index coverage ratio: Pages indexed versus pages submitted
- Core Web Vitals on mobile: Only for the highest-traffic pages
Metrics that usually don’t belong
- Domain authority as a primary KPI: It’s a third-party estimate, not a Google signal. Reporting it as an official metric confuses clients about what actually affects rankings.
- Total backlink count: Fluctuates constantly for irrelevant reasons. Referring domain count is more stable and more meaningful.
- Bounce rate in isolation: Without knowing the page type and user intent, the number says nothing. A blog post with a 90% bounce rate is perfectly normal. A product page with a 90% bounce rate is a problem.
- Rankings for hundreds of terms: Creates an illusion of completeness while hiding what actually matters.
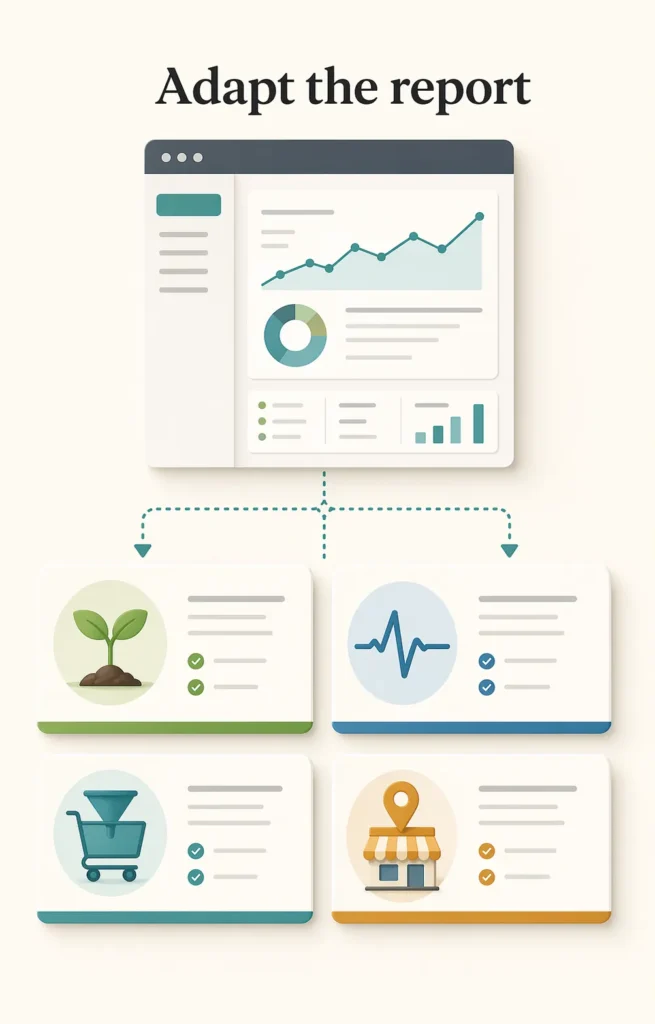
How to adapt the report by project type
The same structure doesn’t serve every situation. A site that’s been live for three months has almost nothing to show in traffic terms. Reporting it the same way as a site with two years of ranking history makes both look worse than they are.
New sites and early-stage campaigns
Traffic isn’t the story yet. The story is infrastructure: pages indexed, technical issues resolved, first positions established. A rank tracker showing ten long-tail keywords moving from “not ranking” to positions between 15 and 40 is real progress for a site in its first quarter. Report it as that, with clear context about when those positions should translate into traffic.
Sites recovering from a penalty or algorithm update
The report needs a specific section on the recovery: what Google’s Search Quality Rater Guidelines flagged as the likely issue, what changes were made, and the week-by-week crawl and indexing data showing whether Google is re-evaluating the affected pages. Traffic alone doesn’t show recovery. Ranking movements and crawl frequency do.
When Google launches an update during the reporting period, the report should mention how the team monitored its impact and what response was taken. Clients who see a traffic fluctuation during a known update and find no mention of it in the report lose confidence in the quality of the monitoring.
E-commerce
The conversion funnel matters more here than anywhere else. Organic traffic that doesn’t convert is a content-to-intent mismatch. If traffic grows while organic revenue stays flat, the usual diagnosis is that the growth is coming from informational queries rather than commercial ones. The competitor research tool shows which commercial terms competitors are capturing that the site isn’t.
Product schema performance also belongs in the report. Rich results directly affect the CTR of positions you already hold, and tracking whether schema is valid and generating rich results is a technical metric with a direct commercial outcome.
Local businesses
Google Business Profile data goes in the report alongside organic search data. Profile views, direction requests, call clicks, and review velocity are the signals that actually move the needle for a local business. 72% of consumers use Google to find local businesses, and top-performing profiles average over 250 photos. A profile with five photos isn’t competing on the same basis as one with 250, and the report should say so.
46% of monthly Google searches have local intent, and 18% of local mobile searches lead to a sale within 24 hours. With those numbers, Business Profile data stops being “profile metrics” and starts being business metrics.
The local SEO tool consolidates this data alongside organic metrics so the report tells one coherent story rather than requiring the client to cross-reference five different dashboards.
How often to report
Monthly is the standard and works well for most projects. Frequent enough to catch problems, spaced enough that there’s always something real to report.
Weekly makes sense in specific situations: during a migration, right after a major algorithm update, or during a technical recovery where changes are happening fast and you need to track the response. Outside those situations, weekly reports tend to say “not much changed this week,” which is wasted time for everyone.
Quarterly works for executive audiences who don’t need monthly working detail but want a strategic view of progress. A quarterly report should show the trend across all three months, not just a quarter-over-quarter snapshot, so the direction of movement is visible rather than just the endpoints.
The reporting cadence should match the speed at which the data can meaningfully change. Keyword rankings for competitive terms move slowly. Crawl error counts can change overnight. Organic traffic trends stabilize over weeks, not days. Reporting everything at the same frequency treats fundamentally different signals as if they operate on the same timescale.

Seasonal comparisons: the mistake that keeps repeating
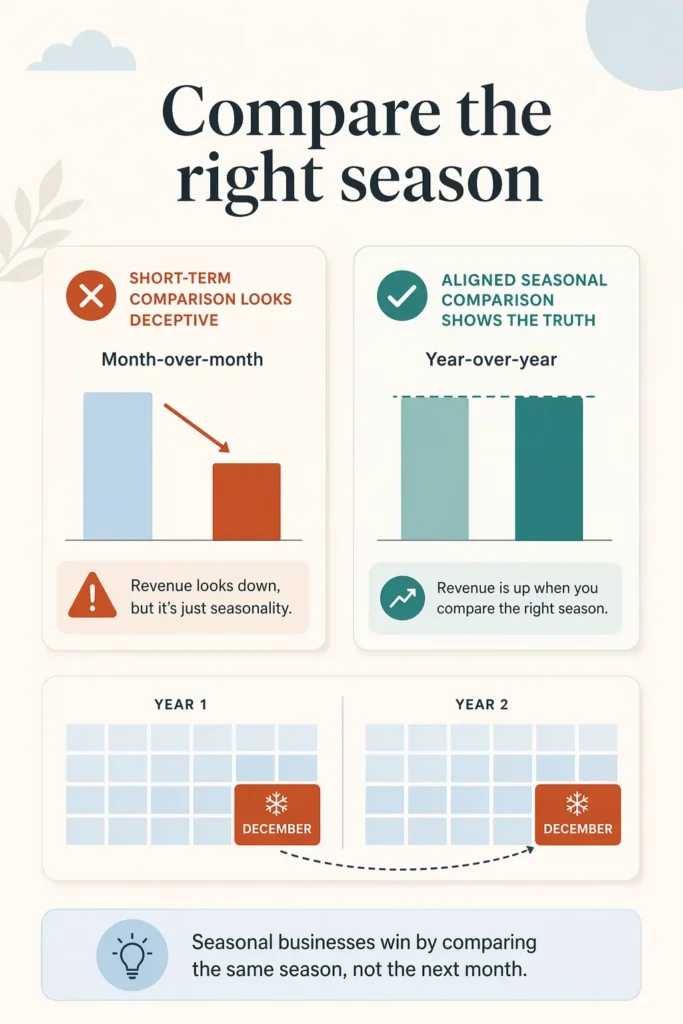
Year over year is the right default for most organic traffic reporting. But seasonal businesses need a different approach, and getting it wrong leads to misleading conclusions.
An e-commerce site comparing December 2025 to November 2025 will always show a traffic increase that has nothing to do with SEO. The same site comparing December 2025 to December 2024 actually tells you something useful. The same principle applies to any business with predictable seasonal patterns: travel, hospitality, accounting, home improvement, education.
The rank tracker stores ranking history so these year-over-year comparisons are straightforward to produce rather than requiring manual data reconstruction every time.
One sentence in the report is enough to prevent confusion: “We compare year over year to account for seasonal traffic patterns.” That removes any ambiguity and stops the client from drawing the wrong conclusions from a monthly chart that happens to look good.
What the reader should know when they’re done
A report that works leaves the reader knowing four things clearly:
- Whether performance is moving in the right direction, with enough data to verify the claim
- Why it moved, with a specific explanation tied to specific actions or external changes
- What the team did this period to produce or respond to that movement
- What happens next, with enough specificity that the team can be held accountable
Every section of the report should serve at least one of those four purposes. If it doesn’t, it belongs in an appendix or a working document, not in the report.
The business case for getting this right is straightforward. SEO still delivers positive ROI for 91% of marketers. But that ROI is impossible to demonstrate without reporting that connects activity to outcomes. A report that shows data without connecting it to decisions doesn’t protect the SEO budget. It just gives whoever signs the invoices another reason to ask whether the spend is justified.
The Wisseo SEO tools suite generates the core data that belongs in each section: ranking movements from the rank tracker, technical issues from the SEO audit, content performance from the content analyzer, backlink changes from the backlink explorer, and AI citation tracking from the AI optimization tool. The tools produce the numbers. The report produces the interpretation. Both are necessary, and only one of them is the job that most reporting skips.
")
")